Table of Contents (See Github for more details!)
Note: This non-exhaustive list contains my personal favorites from my personal life, extracurriculars, and courses.
Highlights!
- Epilog: Rapid Detection of Nonconvulsive Status Epilepticus
- PennMobile Android: Customizable Posts
- FIFAnalytics: Denmark v Tunisia 2022 World Cup
- ETH 2023 Blood Regulation Challenge
- Statistical Modeling of and Predicting NFL Receiving Touchdowns
All Projects
- Epilog: Rapid Detection of NCSE
- Predicting Finger Positions from ECoG
- Implementing Controls for a DNA Ordering System
- FIFAnalytics: Denmark v Tunisia 2022 World Cup
- ETH 2023 Blood Regulation Challenge
- NutriScore: Analysis and Prediction of the Healthiness of Foods
- PennMobile Android: Posts
- Human-Cockroach Machine Interface
- Neural Engram Decoder
- Gym Tracker using Server-Side Swift
- Incorporating AsyncStreams into MongoSwift
- Quantifying Efficiency and Carbon Footprint of Various MongoDB Drivers
- Statistical Modeling of and Predicting NFL Receiving Touchdowns
- SBA BlueScan
- Detecting Breathing Abnormalities with Computer Vision
- Brady Number
- BlockPenn Rewards
- Planetary Destroyer
Epilog: Rapid Detection of Status Epilepticus (video!)
For our senior design project for my bioengineering degree, our group decided on creating a EEG headband to improve patient outcomes from status epilepticus (SE).
SE is charcterized by a long-standing seizure or multiple seizures within 5 minutes. It has a 30% mortality rate and is incredibly difficult to diagnose. Many cases of SE do not present with convulsions (non-convulsive SE, or NCSE), involving only symptoms such as disorientation and fatigue.
We designed a device that measures EEG using 8 surface electrodes (+2 ground electrodes behind the ear), transmits the data to a smartphone app that uses machine learning to detect the presence of a seizure at every second. The device is stored in a reusable case that allows gel to be applied to all the electrodes simultaneously for rapid application. My focus was the detection algorithm (reaching metrics similar to current literature), the smartphone app, and communication between devices (Bluetooth/IoT)
Throughout the design process, we presented our work to neurologists and at pitch competitions to get feedback, ultimately winning the University of Pennsylvania’s Engineering design competition.
Language:
Python, Arduino, Kotlin
Tools/Frameworks:
Django, Scikit, Bluetooth
Project Duration and Date:
10 months, Summer 2023-Spring 2024
Project team size (including myself):
5

One of the coolest things I’ve built and tried on myself!
Predicting Finger Positions from ECoG
This was the final project of a class I wanted to take since high school (no, really), Brain Computer Interfaces.
Given signals collected from the surface of the brain (electrocorticography), our task was to predict the finger flexion angles of each of the 5 fingers of 3 different patients. The first step was to extract features from the raw signal data, which my partner and I did by first bandpassing the data, downsampling, and extracting time- and frequency-based features over a sliding window. We then selected the top 40 features based on the mean correlation magnitudes to the training data.
We then calculated the feature matrix (R) and used linear regressions to calculate the filter matrix (f). Then, we used cubic interpolation to upsample the data to obtain the finger flexion angles for all patients and fingers.
Ultimately, we were able to reach a pearson correlation coefficient of 0.45. It was a very interesting project with many real-world applications, as this data could be used to flex the fingers of a prosthetic hand.
Language:
Python
Tools/Frameworks:
Scipy, Numpy
Project Duration and Date:
1 month, Spring 2023
Project team size (including myself):
2

Implementing Controls for a DNA Ordering System
I spent my 2023 summer in Boston, at biotech giant Ginkgo Bioworks.
Ginkgo specializes in synthetic biology, where strains and organisms are engineered by manipulating genetic code. Biologists can design their own DNA and order it from an internal web app. My project was to implement a way for biologists to mark certain DNA sequences as a control sequence (ex. a positive control that you know will succeed in an experiment for a baseline).
Now, users could easily mark a design sequence as a control with a drop-down menu and see the marked sequence (with an icon) through the entire design and ordering process. The data was also stored in the backend to calculate the amount of replicates and use that information in the vendor API calls.
Throughout the process, I met with end users biweekly to get feedback on the tool and its ease-of-use before putting into production. This was the most rewarding experience of the process, and I learned a lot about designing for non-technical users.
Language:
Python, Javascript, GraphQL
Tools/Frameworks:
Django, React, Graphene, Docker, Cypress
Project Duration and Date:
2 months, Summer 2023
Project team size (including myself):
1

FIFAnalytics: Denmark v Tunisia 2022 World Cup
After spending a couple of months in Europe, I became a huge soccer (sorry, I mean football) fan. What better way to apply my data science skills than to analyze a match from the 2022 FIFA World Cup
At ETH Zürich, we were given access to granular CSV data of matches from the 2022 World Cup as part of the class Soccer Analytics. A group of friends and I examined the data from Denmark v Tunisia match from the group stage. Using data visualizations, animation libraries, video analysis, and basic machine-learning strategies, we were able to look into the teams’ offenses, defenses, pre-match expectations, and goal chances.
While the match ended 0-0, the xG, or expected goals, was approximately 1.2-1.1, meaning there were major goal chances for both sides. It was a lot of fun to analyze the match, especially since there were diehard Danish and Tunisian fans in our group.
Unfortunately, the data is proprietary and a majority of the analysis cannot be shared.
Language:
Python
Tools/Frameworks:
Pandas, Seaborn, SciPy, Streamlit, Matplotlib, MPLSoccer
Project Duration and Date:
4 months, Spring 2023
Project team size (including myself):
5

ETH 2023 Blood Regulation Challenge
Description:
During my time at ETH Zürich, I took a very interesting class called Biofluiddynamics where we learned how to calculate and model properties of fluid flow in the body.
We were given an interesting challenge problem: given a hexagonal grid representing a capillary network, optimize the widths of each capillary segment (side length of a hexagon) to ensure homogenous fluid flow. By default, the fluid piled up on the corners of the symmetric grid due to the Fåhræus Effect.
Most students used logic to reason why certain diameters should be wider or narrower, but I was curious to see how certain algorithms would apply. I tried various things, from brute-forcing to a simplified version of simulated annealing optimization using Python and MATLAB. The percentage of “valid” vessels was to be over 12.5%, where “valid” means a hematocrit concentration between 0.15 and 0.25 (volume of RBC / volume of fluid). I was able to achieve a percentage of 21%.
It was incredible to run the simulation in MATLAB and see the clear effect of changing just a handful of vessel diameters. It’s even more incredible to realize our body is doing these kinds of optimizations automatically all the time!
Language:
Python, MATLAB
Tools/Frameworks:
SciPy
Project Duration and Date:
1 month, Spring 2023
Project team size (including myself):
1

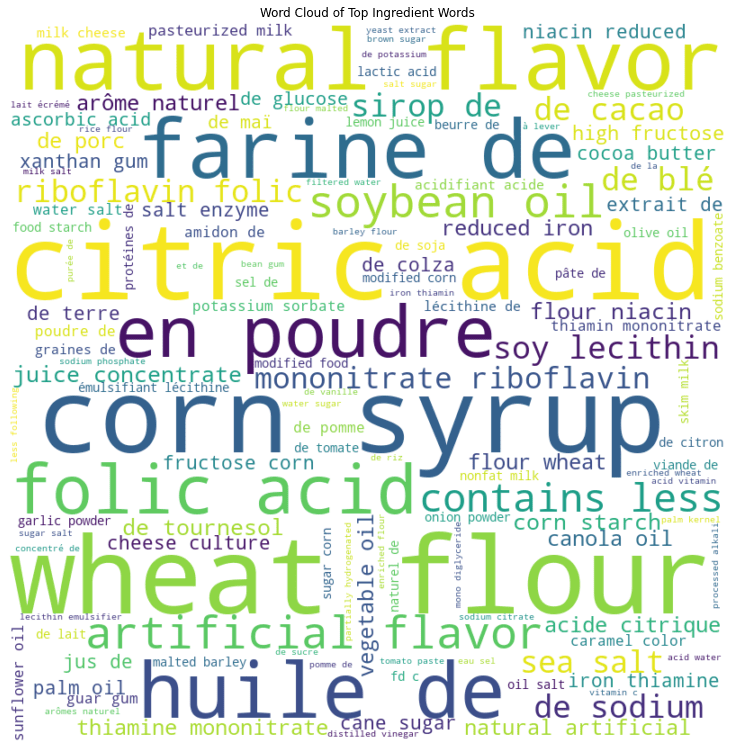
NutriScore: Analysis and Prediction of the Healthiness of Foods
Description:
Since I started getting into fitness, I also got more interested in nutrition, making it a prime place to apply some new skills.
Using the OpenFoodFacts database from Kaggle, we first cleaned and visualized the data. Each food had a health score, ranging from -15 to 40 as a way to measure “healthiness”. After doing a principal component analysis due to feature correlation, we trained various regressors (lasso, ridge) and neural network architectures to predict health scores from nutrition facts, with the lowest test RMSE (root mean square error) of 5.14 from lasso regression and the highest R2 value of 0.959 from a 2-layer neural network.
Since only the macronutrients (carbs, fat, protein) are often available, we tested our models with just these 3 features. We tested regression (elastic net with PCA) and a random forest regressor with hyper-parameter tuning and got the lowest RMSE of about 6.517 with the RandForest.
We’re able to predict the health scores of foods pretty well (on average off by 5-6) with nutrition facts and even just macronutrients!
Language:
Python
Tools/Frameworks:
Jupyter, PyTorch, Pandas
Project Duration and Date:
1 month, Fall 2022
Project team size (including myself):
3
PennMobile Android: Posts
Description:
As a team lead, I lead a team of talented developers and designers to fix bugs and add new features to the PennMobile campus app, the first-choice campus app for all things Penn.
I also completed my own project, which involved creating a way for clubs and other organizations to create custom posts/advertisements on the Android app. Authorized club leaders can access an API endpoint that allows them to publish posts with text, an image, links, and can target a subset of the school (ex. only first-years). We hit another endpoint via Retrofit and use OAuth2 to gain access to all current posts, which we publish onto our homepage for targeted users to view.
Penn Benjamins, a peer counseling group, was the first to create a post and they received over 800 views and 50+ click-throughs in just 1 week. Organizations like student government groups can use this to advertise more effectively and greenly (no more piles of flyers littering Locust Walk!).
Language:
Kotlin, XML
Tools/Frameworks:
Retrofit, OAuth
Project Duration and Date:
5 months, Spring-Fall 2022
Project team size (including myself):
1
Human-Cockroach Machine Interface
Description:
Our task was to manipulate a dissected cockroach leg using electrical signals to emulate a certain human behavior, which we chose to be ballet dancing. Through a combination of circuitry, oscilloscopes, 3D printing/laser cutting, and scripting via MATLAB and python, we created a ballerina box (with the ballerina having a cockroach leg!) with the following functionality:
- The box opens and the ballerina begins to spin ONLY after the microphone detects the correct wake melody (using Fourier Transforms)
- The ballerina’s cockroach leg flexes and contracts when a subject flexes and relaxes their bicep using electromyography (EMG) (connected via electrodes)
- The speed of the ballerina can be controlled by a force sensor (pressing harder slows her down)
- The LEDs in the box will change color based on the position of a switch
Language:
MATLAB, Arduino
Tools/Frameworks:
BIOPAC, myDAQ, WaveGen
Project Duration and Date:
1 month, Fall 2022
Project team size (including myself):
4

Neural Engram Decoder
Description:
Given neuronal firing data about a subject remembering alphanumeric characters (called engrams), we wanted to decode unknown neuron firing patterns to figure out words and phrases that the subject was thinking of.
So, we had to define a firing pattern for each character and use that to decode the final sequence. However, note that firing data has noise, misfired neurons, and the length of each character engram is different and unknown (ex. thinking of “%” takes longer than “a”). So, we used strategies like binarization (neuron firing or not vs. a numerical values), averaging over multiple training sets, and implementing a modular arithmetic-based algorithm to handle variable length window encodings. To choose thresholds for each, we implemented a basic form of machine learning that aimed to reduce the validation error (number of characters different) by tweaking each parameter.
Ultimately, we were able to reliably decode all words and phrases that the subject thought of.
Language:
MATLAB, Python
Tools/Frameworks:
N/A
Project Duration and Date:
2 weeks, Fall 2022
Project date:
2022
Project team size (including myself):
4

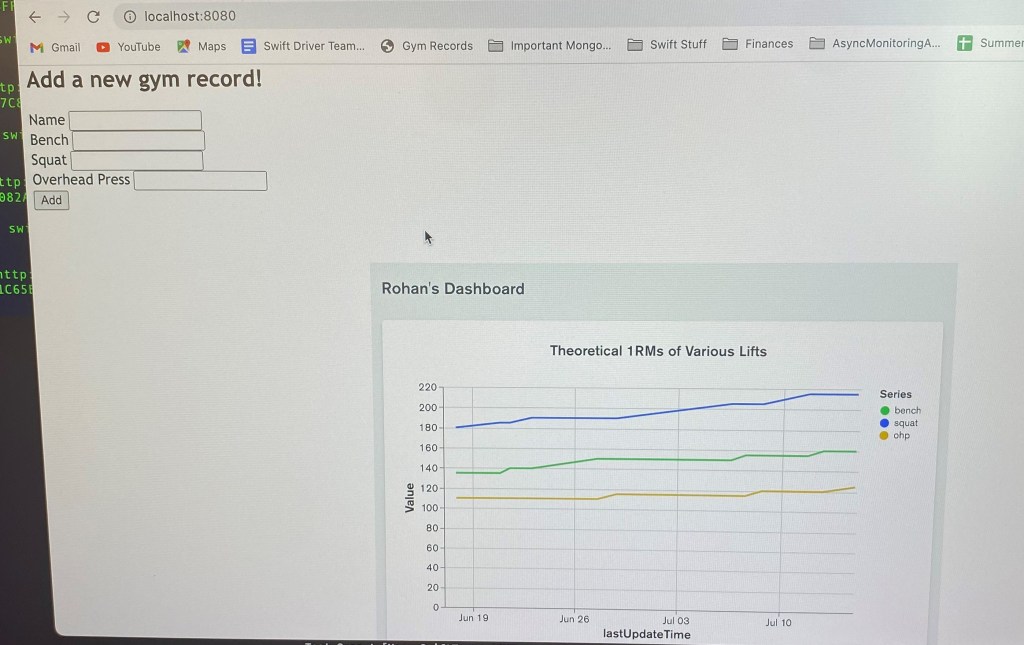
Gym Tracker using Server-Side Swift
Description:
After learning about the blossoming server-side Swift community, I wanted to build something with it. As a regular gym-goer who had recently started a powerlifting lifting schedule, I wanted something to track and visualize my progress. Using a unique stack of Leaf HTTP for the front-end, Swift for the back-end, and MongoDB for the database/graph, I created a site where you can input data about 4 lifts and see progress with an updated line graph and a table underneath. Clicking on each entry in the table will open an in-depth view of the entry with the option to delete it.
It proved to be incredibly useful in tracking and visualizing my progress through my powerlifting journey in summer and following semester.
Language:
Swift
Tools/Frameworks:
Leaf HTTP, MongoSwift
Project Duration and Date:
2 weeks, Summer 2022
Project team size (including myself):
1
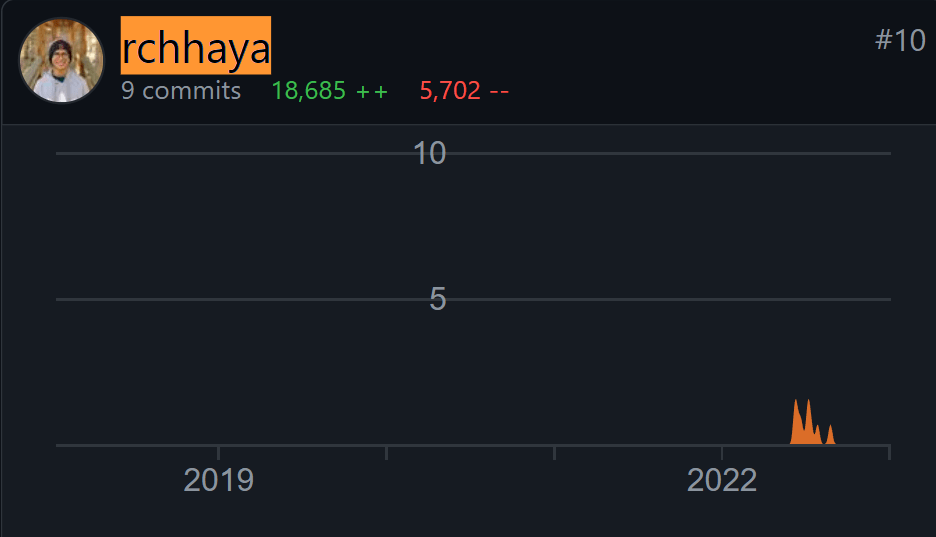
Incorporating AsyncStreams into MongoSwift
Description:
My summer project at MongoDB was to improve the async capabilities of the Swift driver, MongoSwift. With guidance from an amazing team, I created a way to asynchronously iterate over events (the status quo was to explicitly declare an event listener which provides synchronous access to events).
I wrapped the AsyncSequence struct and implemented the AsyncIteratorProtocol for custom functionality. Some features include a buffering policy, encapsulation (least privilege), and an updated test runner that can handle async testing. Calling the factory methods .commandEventStream() or .sdamEventStream() on a client allows you to iterate over events asynchronously using the await keyword!
I merged in my work into the open-source MongoDB repo! Check out async event monitoring endpoints here and an updated test runner here
Language:
Swift
Tools/Frameworks:
SwiftBSON, MongoSwift
Project Duration and Date:
2 months, Summer 2022
Project team size (including myself):
1
Quantifying Efficiency and Carbon Footprint of Various MongoDB Drivers
Description:
As part of an internal hackathon at MongoDB, our team wanted to quantify the environmental impact of MongoDB and how to inform users. We looked into the energy usage and carbon footprint of Atlas clusters at various tiers/cloud providers and different official MongoDB drivers and how to update the dashboard with easy-to-understand information.
I wrote a simple test suite with 100 inserts, updates, replaces, and deletes in 7 different languages. By timing the operations and using the Mx Power Gadget to quantify the energy usage, I was able to rank the overall efficiencies of each driver. By combining my information with the other groupmates, we were able to create a presentation on the best practices to be green with MongoDB and how to best let users know.
We won the Green Award, were featured in a MongoDB blog post, and were able to use the prize money to plant 34 trees in South Africa through a charity.
Language:
Node.js, Go, Swift, Python, Java, Rust, C#
Tools/Frameworks:
MongoDB, Mx Power Gadget
Project Duration and Date:
1 week, Summer 2022
Project team size (including myself):
5 (different sub-projects)

Modeling and Predicting NFL Receiving Touchdowns
Description:
After learning about the NBD model (Negative Binomial) as a tool to model distributions with no upper bound and a majority of the data around 0 or 1, I wanted to apply it to something I enjoy, like the NFL and receiving touchdowns. By using MLE (maximum likelihood estimation) on the 2021 NFL data, I obtained the model parameters r and α. After checking the fit of the model with a visual check, χ2 test, and a method of moments analysis, I applied the model to 2020 data and found strong predictive power.
Using non-unit time analysis, I could predict how many players would have a certain amount of receiving touchdowns if they played the same amount of time (ex. if everyone played 1 game, 241 players would have 1 receiving touchdown, 31 would have 2, etc.). Useful to track over/under-performance trends across a season!
Language:
Excel
Tools/Frameworks:
Solver (Gradient Descent)
Project Duration and Date:
3 weeks, Spring 2022
Project team size (including myself):
1

SBA BlueScan
Description:
My project for SBA communications, a telecommunications infrastructure company, was to create Android app that scans for devices, analyzes certain information about them (services offered, GATT profile, device type, distance, etc.), and store them in an Azure database. The app is for field workers’ phones who visit and maintain cell tower sites to track visitors and potential trespassers (especially for conservation areas).
I designed an Android app that scanned for nearby devices and for the current location every 30 seconds, with manual refresh and background refresh possible (with notifications). The devices and their information would appear on-screen, be stored on a SQLite database on the device, and then sent to an Azure SQL database via a custom Node backend when an internet connection was obtained (to allow for functionality in remote areas). The data was then queried and visualized on a GIS map to determine site visitors.
Language:
Java, Node.js, XML
Tools/Frameworks:
Android Studio
Project Duration and Date:
4 months, Summer-Fall 2021
Project team size (including myself):
1

Detecting Breathing Abnormalities with Computer Vision
Description:
The inabilty to take a deep breath, a form of dyspnea, is linked to asthma, COPD, hypotension, and other severe medical problems. To assist in early detection and as a diagnostic assistant, we wanted to create a computer vision approach that could classify whether a person is breathing deeply or shallowly from a cellphone video.
We contacted authors of papers on breathing videos to access their dataset, but got denied. So, we created our own dataset with 200 videos from 10 participants (10 shallow and 10 deep from each) and processed the data ourselves (convert to a series of grayscale frames). We trained various convolutional neural network (CNN) architectures based on well-performing ones in similar medical domains. Due to poor data quality (ex. loose clothing that masked chest movement), we only achieved about 59% accuracy, but the idea is promising and will be investigated further.
Language:
Python
Tools/Frameworks:
PyTorch
Project Duration and Date:
4 months, Spring-Fall 2021
Project team size (including myself):
4

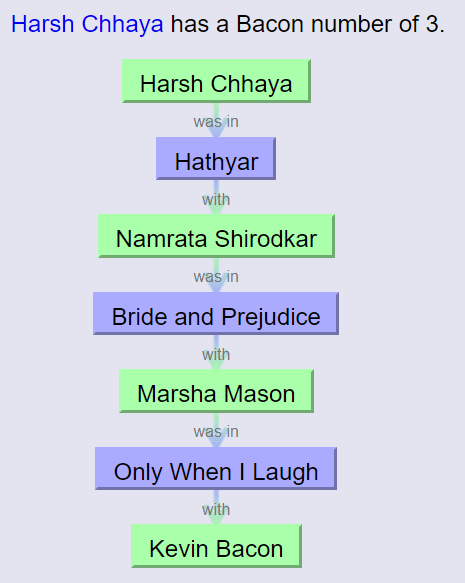
Brady Number
Description:
The Bacon number and Erdős number are phenomena in network theory that explains how interconnected a person is to another, originally to Kevin Bacon for actors and Paul Erdős for academics. This project aimed to quantify the “degrees of seperation” between any 2 active pro football (NFL) players. We defined 1 degree as playing on the same team at the same time.
We first scraped Pro Football Reference to obtain every currently active NFL player and information about their position and team. Then, we constructed an information graph, asked the user for input through a Swing UI, and used breadth-first-search (BFS) to trace and display the shortest path. We ran into issues with same-name collisions, which happened more than expected (ex. Josh Allen the Bills quarterback and Josh Allen the Jaguars linebacker) and solved it by prompting the user for position information if such a name was inputted.
Super fun to play around with with friends!
Language:
Java
Tools/Frameworks:
Java Swing, JSoup
Project Duration and Date:
2 weeks, Summer 2021
Project team size (including myself):
3
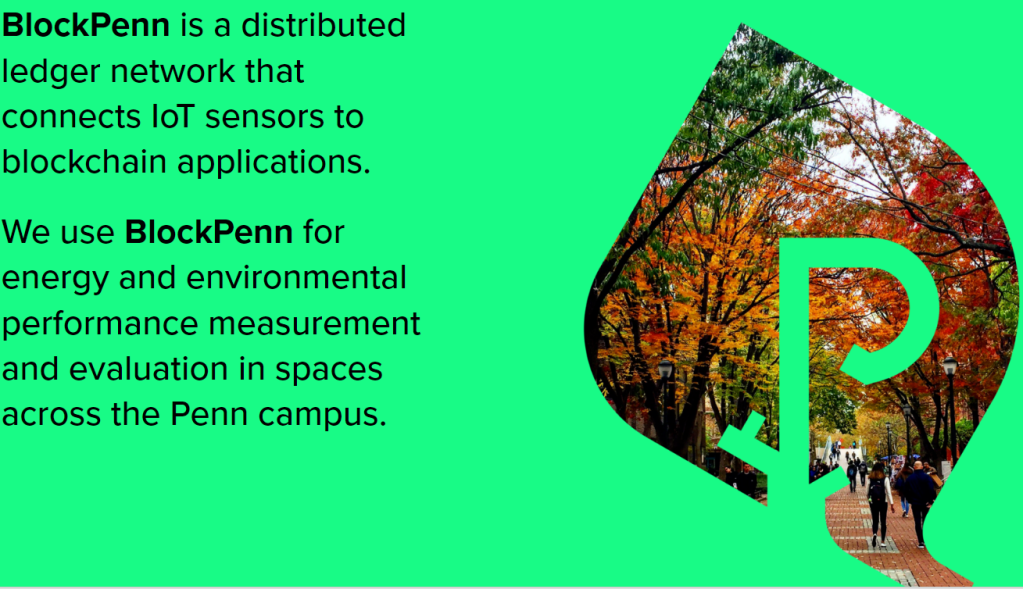
BlockPenn Rewards
Description:
As a group, we all grew up with our parents berating us for leaving the lights on in an empty room. To discourage energy-inefficient behaviors like this, I joined a group of electrical engineering students to create a mechanism to detect them and incentivize positive behaviors.
By using IoT sensors (ex. heat, sound, light, air quality, etc.) and Arduino, we could detect room occupancy and utility usage. We then rewarded efficient behaviors (ex. having the lights off in an empty room) by giving tokens to the best-performing and most improved users. We ran into challenges with classifying sunlight vs. artificial light but solved them by classifying light based on wavelength.
Our project was integrated into a senior design project, where they incorporated smart contracts to award “PennCoin” tokens on the blockchain. This incentive program could be used for discounts from utility companies.
Language:
Arduino, Python
Tools/Frameworks:
IoT, Blockchain
Project Duration and Date:
3 months, Spring-Summer 2021
Project team size (including myself):
5
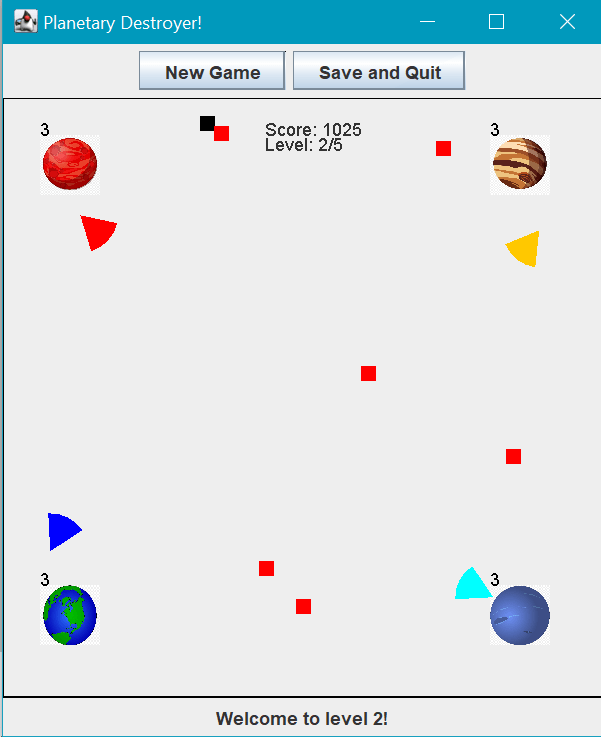
Planetary Destroyer
Description:
I first learned coding by building fun minigames like Hangman (in Java) and Space Invaders (in Python). Once I learned more about programming concepts like encapsulation, object-oriented vs. functional, file input/output, and so on, I wanted to build a more complex game, inspired by flash games.
You play as Earth and there are 3 other planets, each in a corner. Each planet, including you, has a shield and the ability to shoot bullets. You control the shield with spacebar and the shield with left/right arrows. The shield stops bullets and if a bullet hits a planet, they lose a life (3 lives). If you are able to kill all the other planets before you lose all 3 lives, you advance to the next level, which features faster and more accurate shooting from your opponents. After 5 levels, you win!
There is “save and quit” functionality that saves the score, level, and number of lives of each planet using file I/O. The home screen allows you to see detailed instructions, start a new game, or load in saved game data.
Super fun and just like the flash games I used to play as a kid!
Language:
Java
Tools/Frameworks:
Java Swing
Project Duration and Date:
3 weeks, Winter 2021
Project team size (including myself):
1